| Product Catalog: |
Hysteresis Graph Test System
- DX-2010SD DC Hysteresis Graph Test System
- DX-2010H DC Hysteresis Graph Test System
- DX-2010M AC Hysteresis Graph Test System
- DX-2010SA AC Hysteresis Graph Test System
| Product Detail: |
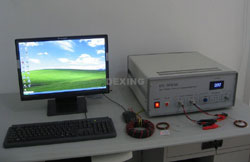
 Automatic measurement of the dynamic magnetic hysteresis loop of oriented and non-oriented silicon steel under the condition of 50 Hz, 60 Hz, 400 Hz and 1 kHz, accurate measurement of the static magnetic characteristic parameters such as amplitude permeability μa, loss angle δ, specific total loss Ps, remanence Br and coercivity Hc. With special testing fixture, it can directly measure the iron core and stator core of the transformer.
Windows measurement software applied simply. The product conforms to China National Standards GB/T 3655-2000, GB/T 13789-92 and international standard IEC 404-2, IEC 60404-3, IEC 60404-6.
The controlling of computer and A/D sampling replace the traditional analog bridge, frequency meter, ammeter, voltage meter, power meter, the whole testing process is automatic completed.
General Features of AC Hysteresis Graph (DX-2010M)
- Testing sample varieties: hot rolling, cold rolling silicon steel materials, permalloy, amorphous and nm crystal.
- Testing sample shapes: ribbon and chip open samples, annular, E and U closing samples.
- Open circuit samples adopt EpsteinSquare to form closed magnetic circuit, can also select permeameter. Closing sample can be put under direct winding measurement, finished transformer can be also put under direct measurement.
- Sample( iron core), magnetizing coil (N1) and measuring coil (N2) form a no-load transformer.
- Non-inductive resistance connected on magnetizing coil loop to determine magnetizing current and magnetic field intensity through the measurement of pressure drop on non inductive resistance, magnetic field peak value can be locked through digital feedback, magnetic field lock precision 0.5%.
- Magnetic induction density obtained through digital integration of coil measuring voltage, magnetic induction peak value locked through digital feedback, magnetic induction lock precision 0.2%.
- Power source and sampling amplifier integrated into a casing with simple interface: one RS232 interface connected to the computer, two way voltage signal connected to A/D card.
- Adopt volammetry and digital integration to measure dynamic hysteresis loop, can accurately measure dynamic magnetic characteristic parameters such as µa, d, Ps, Br and Hc, etc.
- Automatic and continuous measurement up to 255 testing points, the testing time of every testing point is about 30 seconds, fixed-frequency, fixed Bm or fixed Hm optional in multipoint test.
Software Features of AC Hysteresis Graph (DX-2010M)
Operate under Windows 95 / 98, Windows 2000 / XP operating systems, conform to Windows software specification, visual and simple operation.
Full automatic control, intelligent identification, user intervention unnecessary in entire testing process.
Sampling waveform and instrument status under real-time monitoring, and can be stopped at any time.
The effective sectional area and length of magnetic path of samples can be calculated according to the overall dimension of samples.
File system adopts database format, can directly print or output test result to Excel form.
Powerful file management functions: data saving, deletionb and removal.
Data files contain complete sampled data, sample parameters, instrument parameters and testing schemes, adopt text format, can be conveniently typed into other software.
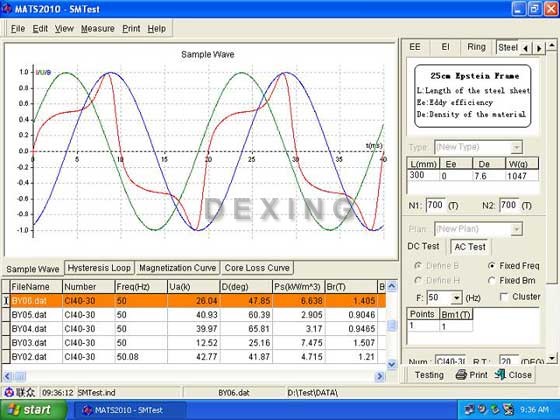
Display I (t), U (t) and B (t) sampling waveform and B (H) hysteresis loop, and coordinate message at every data point on the curve.
Multipoint cluster, can display B (H) magnetic hysteresis cycle cluster, B (H) magnetization curve, µa (H) permeability curve and Ps (B) damage curve, and can display coordinate message at every data point on the curve.
B (H) magnetization curve and Ps (B) damage curve measured under different conditions can be combined on one drawing for comparative analysis.
Set up upper and lower limits according to µa, Ps, Bm, Br, Hc and Hm, etc., qualify test result and determine through the color of data table.
Support various models of printers, test report accurately match printer sheet.
Print preview function, can conveniently regulate the size and edge distance of test report.
Test report can be directly printed, or generate JPG image file.
JPG image file can be sent directly through E-mail, or saved into disk.
Test reports contain complete curve diagrams, test results, test conditions and sample parameters. To facilitate adding user mark and enterprise name.
Multiple unit systems optional to satisfy the application habits of different users.
Software Screen of AC Hysteresis Graph (DX-2010M)
Technical Data of AC Hysteresis Graph (DX-2010M)
System Specifications
Under 50Hz frequency, use 25cm EpsteinSquare to measure silicon steel sample, technical indices as follows:
| Parameters measured | Bm (%) | Hm(%) | µa(%) | Ps(%) | d(%) |
| Uncertainty (k=2) | 1 | 1 | 2 | 1 | 2 |
| Repeatability (constant temperature) | ± 0.5 | ± 0.5 | ± 1 | ± 0.5 | ± 1 |
Instrument Specifications
| DX - 2010M Dynamic Hysteresis Graph | PC6112 A/D Card | |
| Output Power: 500VA sine wave Frequency Range: 45Hz~ 1000Hz Frequency Fineness:1Hz Frequency Error: < 0.05% Output Voltage: 0 ~ 10V ~ 50V ~ 150V ~ 300V, four automatic ranges Voltage Fineness: Program Control 1mV, panel < 0.1% * current range Voltage Distortion Factor: Superior to 0.5% Voltage Stability: Superior to 0.02% Sampling Current: 2mA, 5mA, 10mA, 20mA, 40mA, 80mA, 200mA, 400mA, 800mA, 1.6A, 4A, 8A (Peak Value) Sample Voltage: 20mV, 40mV, 100mV, 200mV, 400mV, 800mV, 2V, 4V, 8V, 16V, 40V, 80V, 160V, 320V, 800V, 1600V (Peak Value) |
Conversion time: <= 2.5µ s (every channel) Resolution and Linearity: 16 Bits ± 1 LSB Voltage Range: ± 5V ~ ± 10V Sampling Clock:6µ s ~ 10ms Hardware Clock Internal Storage Capacity: 4k Bytes Bus Structure: PCI busbar |
Standard Package of AC Hysteresis Graph (DX-2010M)
Basic Configuration
| Serial No. | Product Name | Model | Quantity |
| 1 | Test Power Supply | TPS-500M | 1 |
| 2 | Data Acquisition Card | PC6112 | 1 |
| 3 | Measurement Software | SMTest | 1 |
| 4 | Computer | Dell Dimension E-520n | 1 |
| 5 | Printer | HP1020 laser printer | 1 |
| 6 | EpsteinSquare | 25 cm | 1 |
| 7 | Square Standard Specimen | About 1kg | 1 |
Options
| Serial No. | Options Name | Functional Description | Remark |
| 1 | 500mm×500mm SST | Applies to measure half sheet of stalloy | |
| 2 | 1000mm×1000mm SST | Applies to measure whole sheet of stalloy | |
| 3 | Nonstandard Permeameter | Applies to measure stalloy with special size | As required by users |
 NdFeB production line
 Vacuum Induction Melting Furnace
